The Framework Evolved
I don't apply DITRIX as a named, structured process anymore. What changed is how I think about prioritization — and those changes show up in every project, whether or not anyone calls it DITRIX.
Working across Bilfinger, Diconium, and CARIAD, I kept encountering the same conditions: limited trust in UX process, engineering teams with legitimate concerns about scope, and pressure to show results within sprint cycles. The questions DITRIX taught me to ask turned out to be just as useful in a multi-brand automotive context as they were in industrial SaaS.
UX Maturity Shapes Everything, and Most Industrial Companies are at the Beginning
Before explaining what DITRIX is, it's worth explaining when it matters. UX maturity describes how embedded user-centred thinking is inside an organization's development process. In Germany's industrial sectors, most companies are at an early stage. UX exists, but sits at the edges.
DITRIX is not designed for high-maturity organizations. It's designed for the middle of that journey, where UX has earned a seat at the table but hasn't yet earned the budget and bandwidth to run a full HCD cycle on every decision.
Low Maturity
UX as decoration
Growing Maturity
UX present, underresourced
High Maturity
UX embedded in process
Design seen as beautification. Research deprioritized. Engineers make UX decisions without data.
DITRIX: builds the case
Research exists but implementation is ad hoc. Findings compete with backlog without a clear priority framework.
DITRIX: strongest fit
Dedicated UX team, regular research cycles, established design-dev workflow.
DITRIX: not needed
Bilfinger Digital Next was squarely in the middle column. Research happened. Recommendations were written. But at sprint planning, the designer's priority list and the engineering team's effort estimates were two separate documents, and they rarely met.
Frequency × Severity = True Impact
The insight came from video analysis on PIDGraph. I was reviewing session recordings and started counting, not just whether an interaction caused errors, but how often it occurred. A bad button is not equally important in all contexts.
Certain core interactions were performed over 200 times per hour. Every second of friction multiplied across the entire working day. That's not a usability issue anymore, it's a productivity cost with a calculable value.
THE REALIZATION AT THE CORE OF DITRIX
Severity of problem
×
Frequency of use
=
True user impact
Example from PIDGraph: "Save and download buttons look identical" — medium severity on its own. But 100% of engineers hit this every session, and 67% manually verify the file afterwards every time. Suddenly this isn't a medium finding. It's a daily productivity drain.
What DITRIX keeps from standard practice
User observation as the primary data source. Behavioural evidence over opinions. Commitment to acting on what users actually do, not what they say.
What DITRIX adds
Frequency data as an impact multiplier. Developer effort estimates as a co-owned input. A shared priority output that maps directly to sprint user stories — no translation step required.
Three Inputs. One Joint Output.
The insight came from video analysis on PIDGraph. I was reviewing session recordings and started counting, not just whether an interaction caused errors, but how often it occurred. A bad button is not equally important in all contexts.
01. User observation
Collect behavioral data
02. Parallel assessment
Impact + effort, simultaneously
03. Joint matrix
Co-owned prioritization
Contextual inquiry and video analysis. Capture frequency, time-on-task, and error rate per interaction — not just whether errors occur, but how often.
Designer scores impact using behavioral frequency data. Developer scores effort against existing architecture. Both work from the same prototype reference. No separate meetings.
Findings plotted on impact/effort matrix. High impact + low effort = immediate priority. Each item already has its user story rationale and effort estimate baked in.

Impact scores derived from usage frequency and time-on-task data. Effort scores from workshop with technical persons. Both axes empirical, no guesswork.
More Efficient for Low-Maturity Contexts
I ran DITRIX in combination with a standard HCD process on the same PIDGraph data, comparing them on efficiency, agile alignment, and coverage of user needs. The results were clear, and so were the limitations.
DITRIX
+
No additional user sessions needed — impact derived from existing observation data
+
Priority output maps directly to agile user stories — no translation step
+
Developers co-own the output — less friction at sprint planning
+
Easier to justify in low-maturity orgs — shows ROI without a long research cycle
−
Not iterative by design — works best as a sequential, phase-based process
−
Can miss new problems that only surface during user testing of the redesign
STANDARD HCD (ISO 9241-210)
+
Genuinely iterative: each cycle can discover new needs
+
Deeper validation, actually tests the redesigned solution with users
−
Requires new user sessions — expensive and slow in B2B industrial contexts
−
Engineering still receives the priority list rather than helping build it
−
Harder to justify in low-maturity orgs — cycle length makes ROI less visible
DITRIX isn't a replacement for HCD — it's a different tool for a different organizational moment. As maturity grows, the full HCD cycle becomes both feasible and necessary. But in the early stages, DITRIX gives you a path to visible wins that earns the space for deeper work later.
Context
Bilfinger Digital Next
Type
Methodology & validation
Year
2021
Not All Findings are Equal: a Smarter Way to Prioritize Design Changes
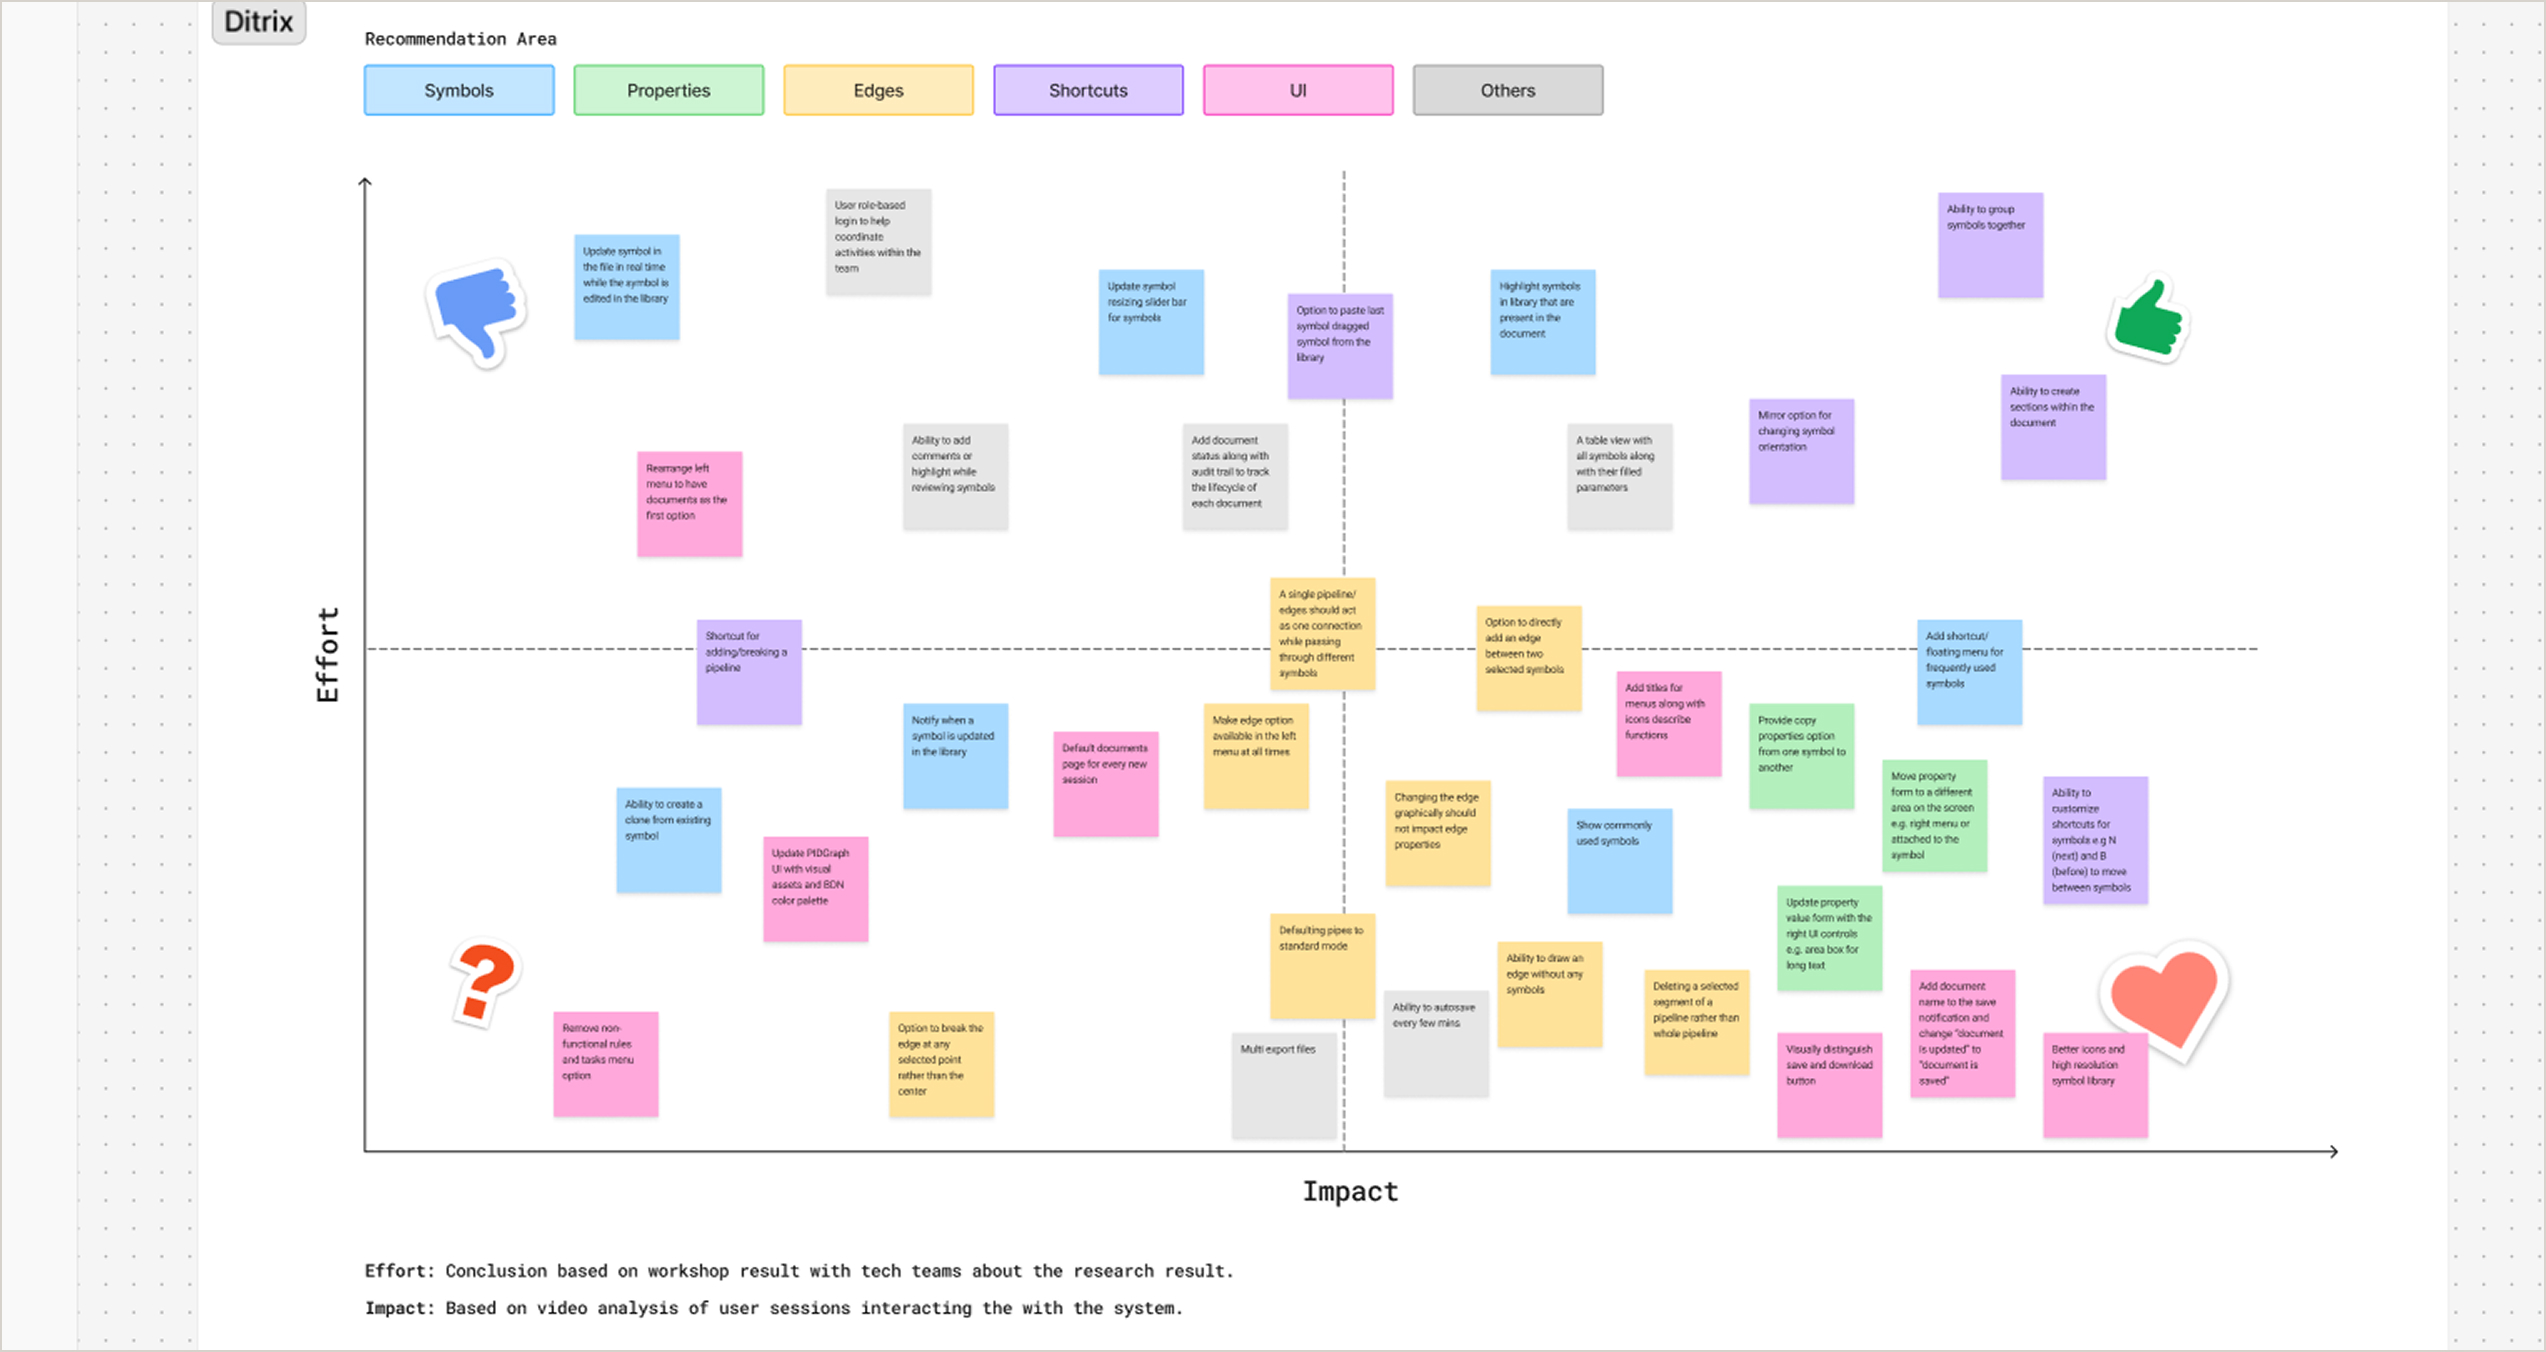
Design Impact Matrix (Ditrix): is an original prioritization methodology for implementing design process in a low UX maturity organizations.
In low-maturity organizations, even good research gets shelved. Not because the findings are wrong, but because designers have no tool to show which ones are worth the engineering investment. This is how I built one.

THREE QUESTIONS I NOW ASK BEFORE PRIORITIZING ANYTHING
01
How often does a user actually encounter this?
Frequency is the multiplier. A medium-severity problem that occurs 200 times per session outranks a high-severity problem that occurs once. Without frequency data, prioritization is guesswork dressed up as judgment.
02
What does it cost engineering to fix, relative to what it costs the user to work around it?
If the fix is cheap and the workaround is expensive — in time, errors, or frustration — that's a quick win with a clear business case. Surfacing this comparison early removes friction from sprint planning rather than generating it.
03
Am I presenting engineering with a decision, or involving them in making one?
Developers who co-own a priority output implement it differently than those who receive it. In low-maturity organizations especially, joint ownership is often what makes the difference between a recommendation that ships and one that doesn't.
The PIDGraph case study shows what the product became. This one shows how the priorities were set — and why those 40+ recommendations didn't all ship at the same time.
PIDGraph Case Study →
Michael Gibran
Senior Product Designer
Berlin, Germany
© 2026 Michael Gibran