One operating principle across every dashboard: the glance has to be enough
Process engineers and plant operators don't sit in front of dashboards studying them. They glance — and in that glance, they need to know whether the assets they're responsible for are running within normal parameters or whether something requires immediate attention.
During three years at Bilfinger Digital Next, I designed 10+ dashboards across different clients and industrial contexts. The three shown below are examples I've been able to share publicly — each originally redesigned to remove client-specific data and visual identity while preserving the design logic and structure.
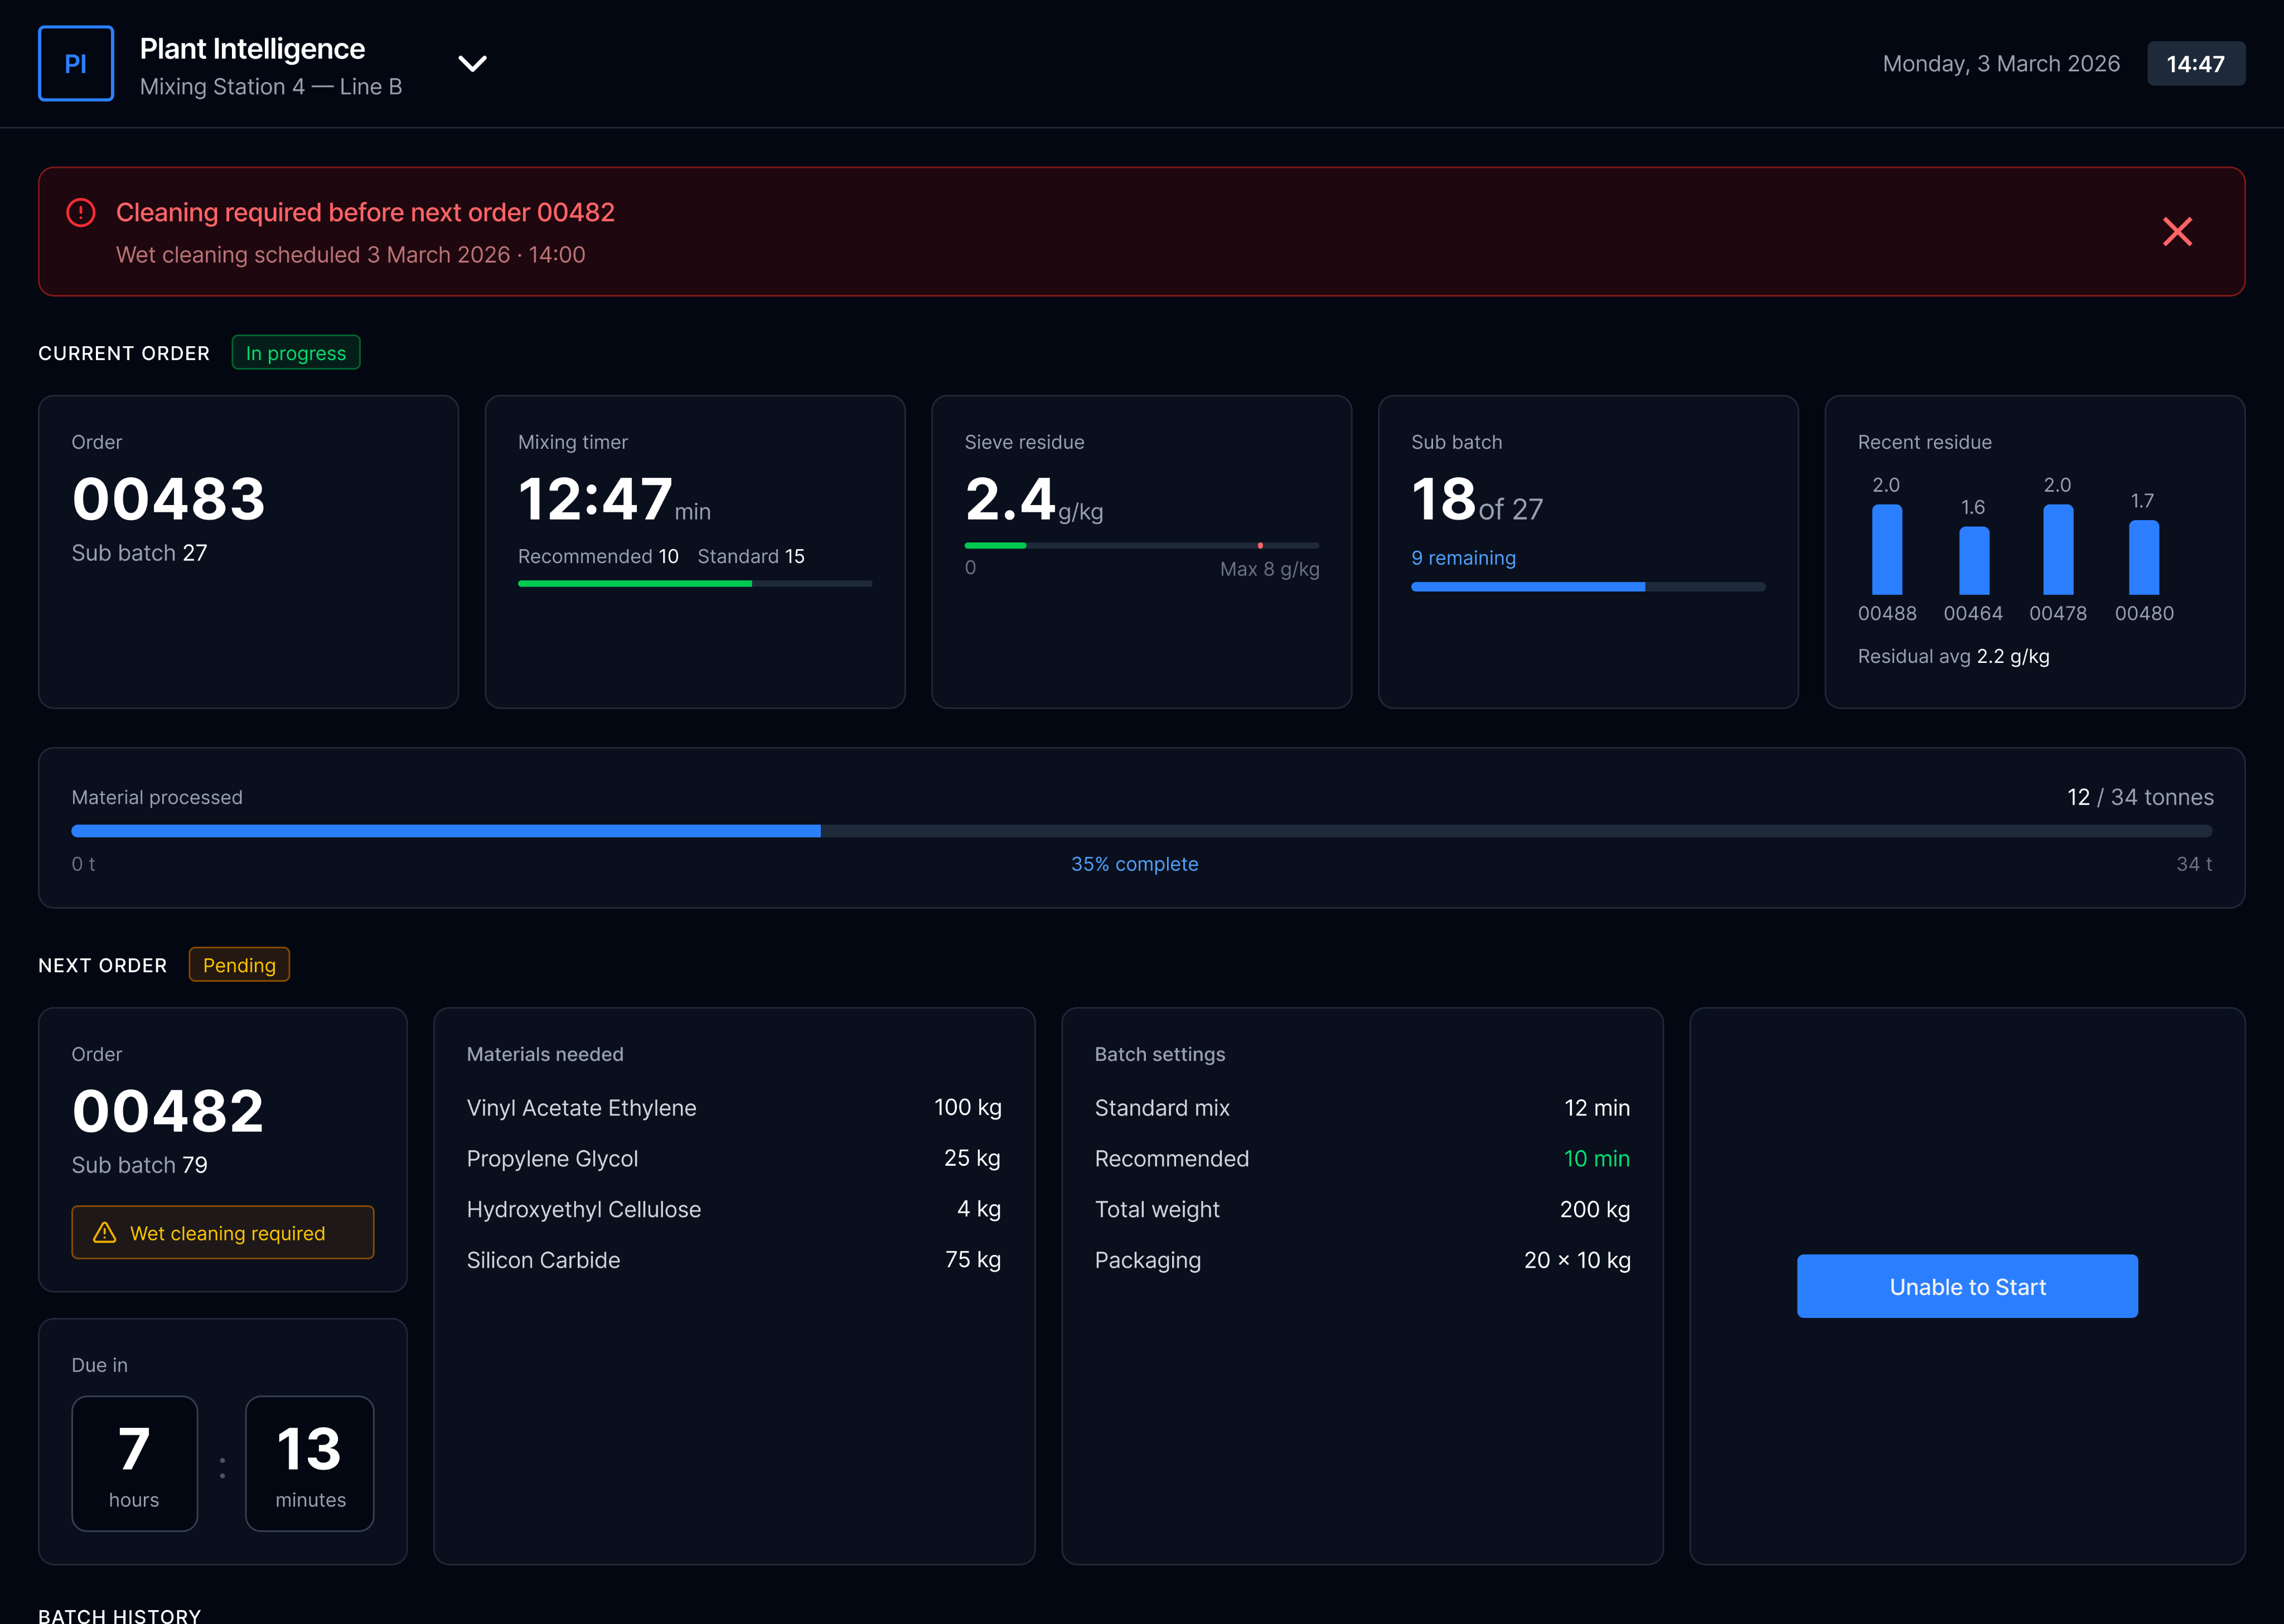
Plant Intelligence
Batch production management — current order, progress, materials, next order queue
Mixing Station
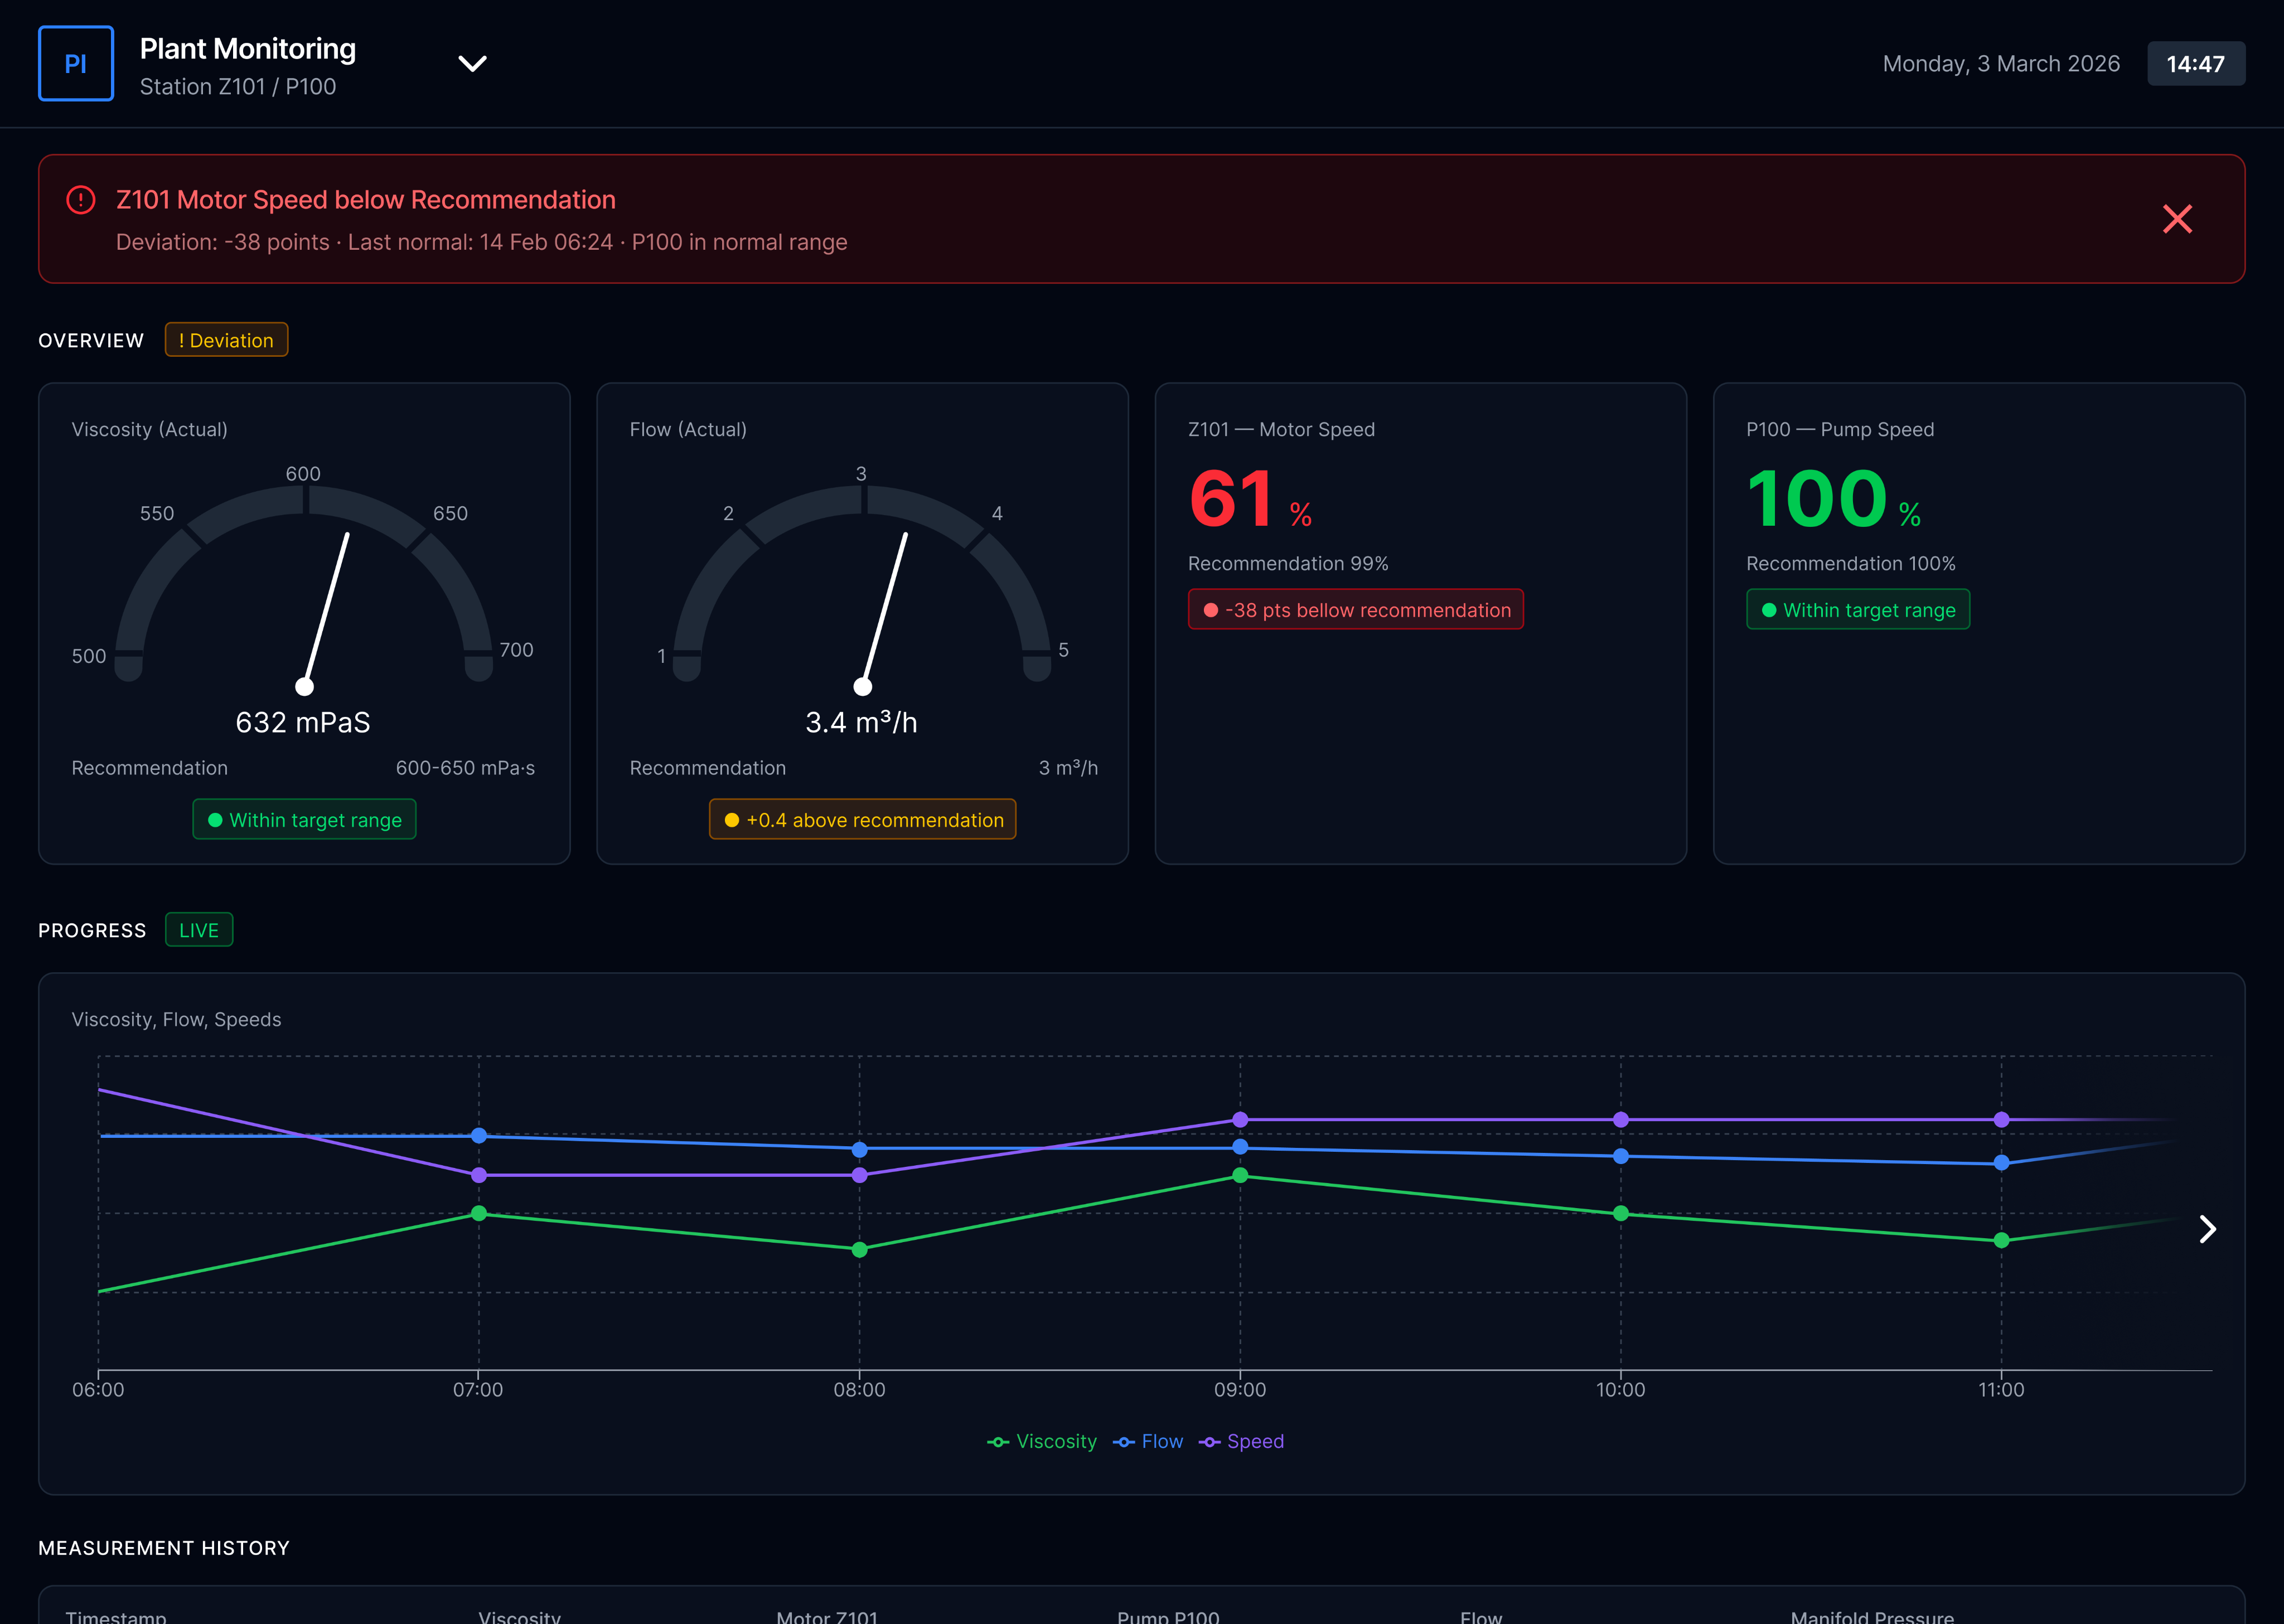
Plant Monitoring
Real-time asset parameters — viscosity, flow rate, motor speed with deviation alerts
Live Sensor Data
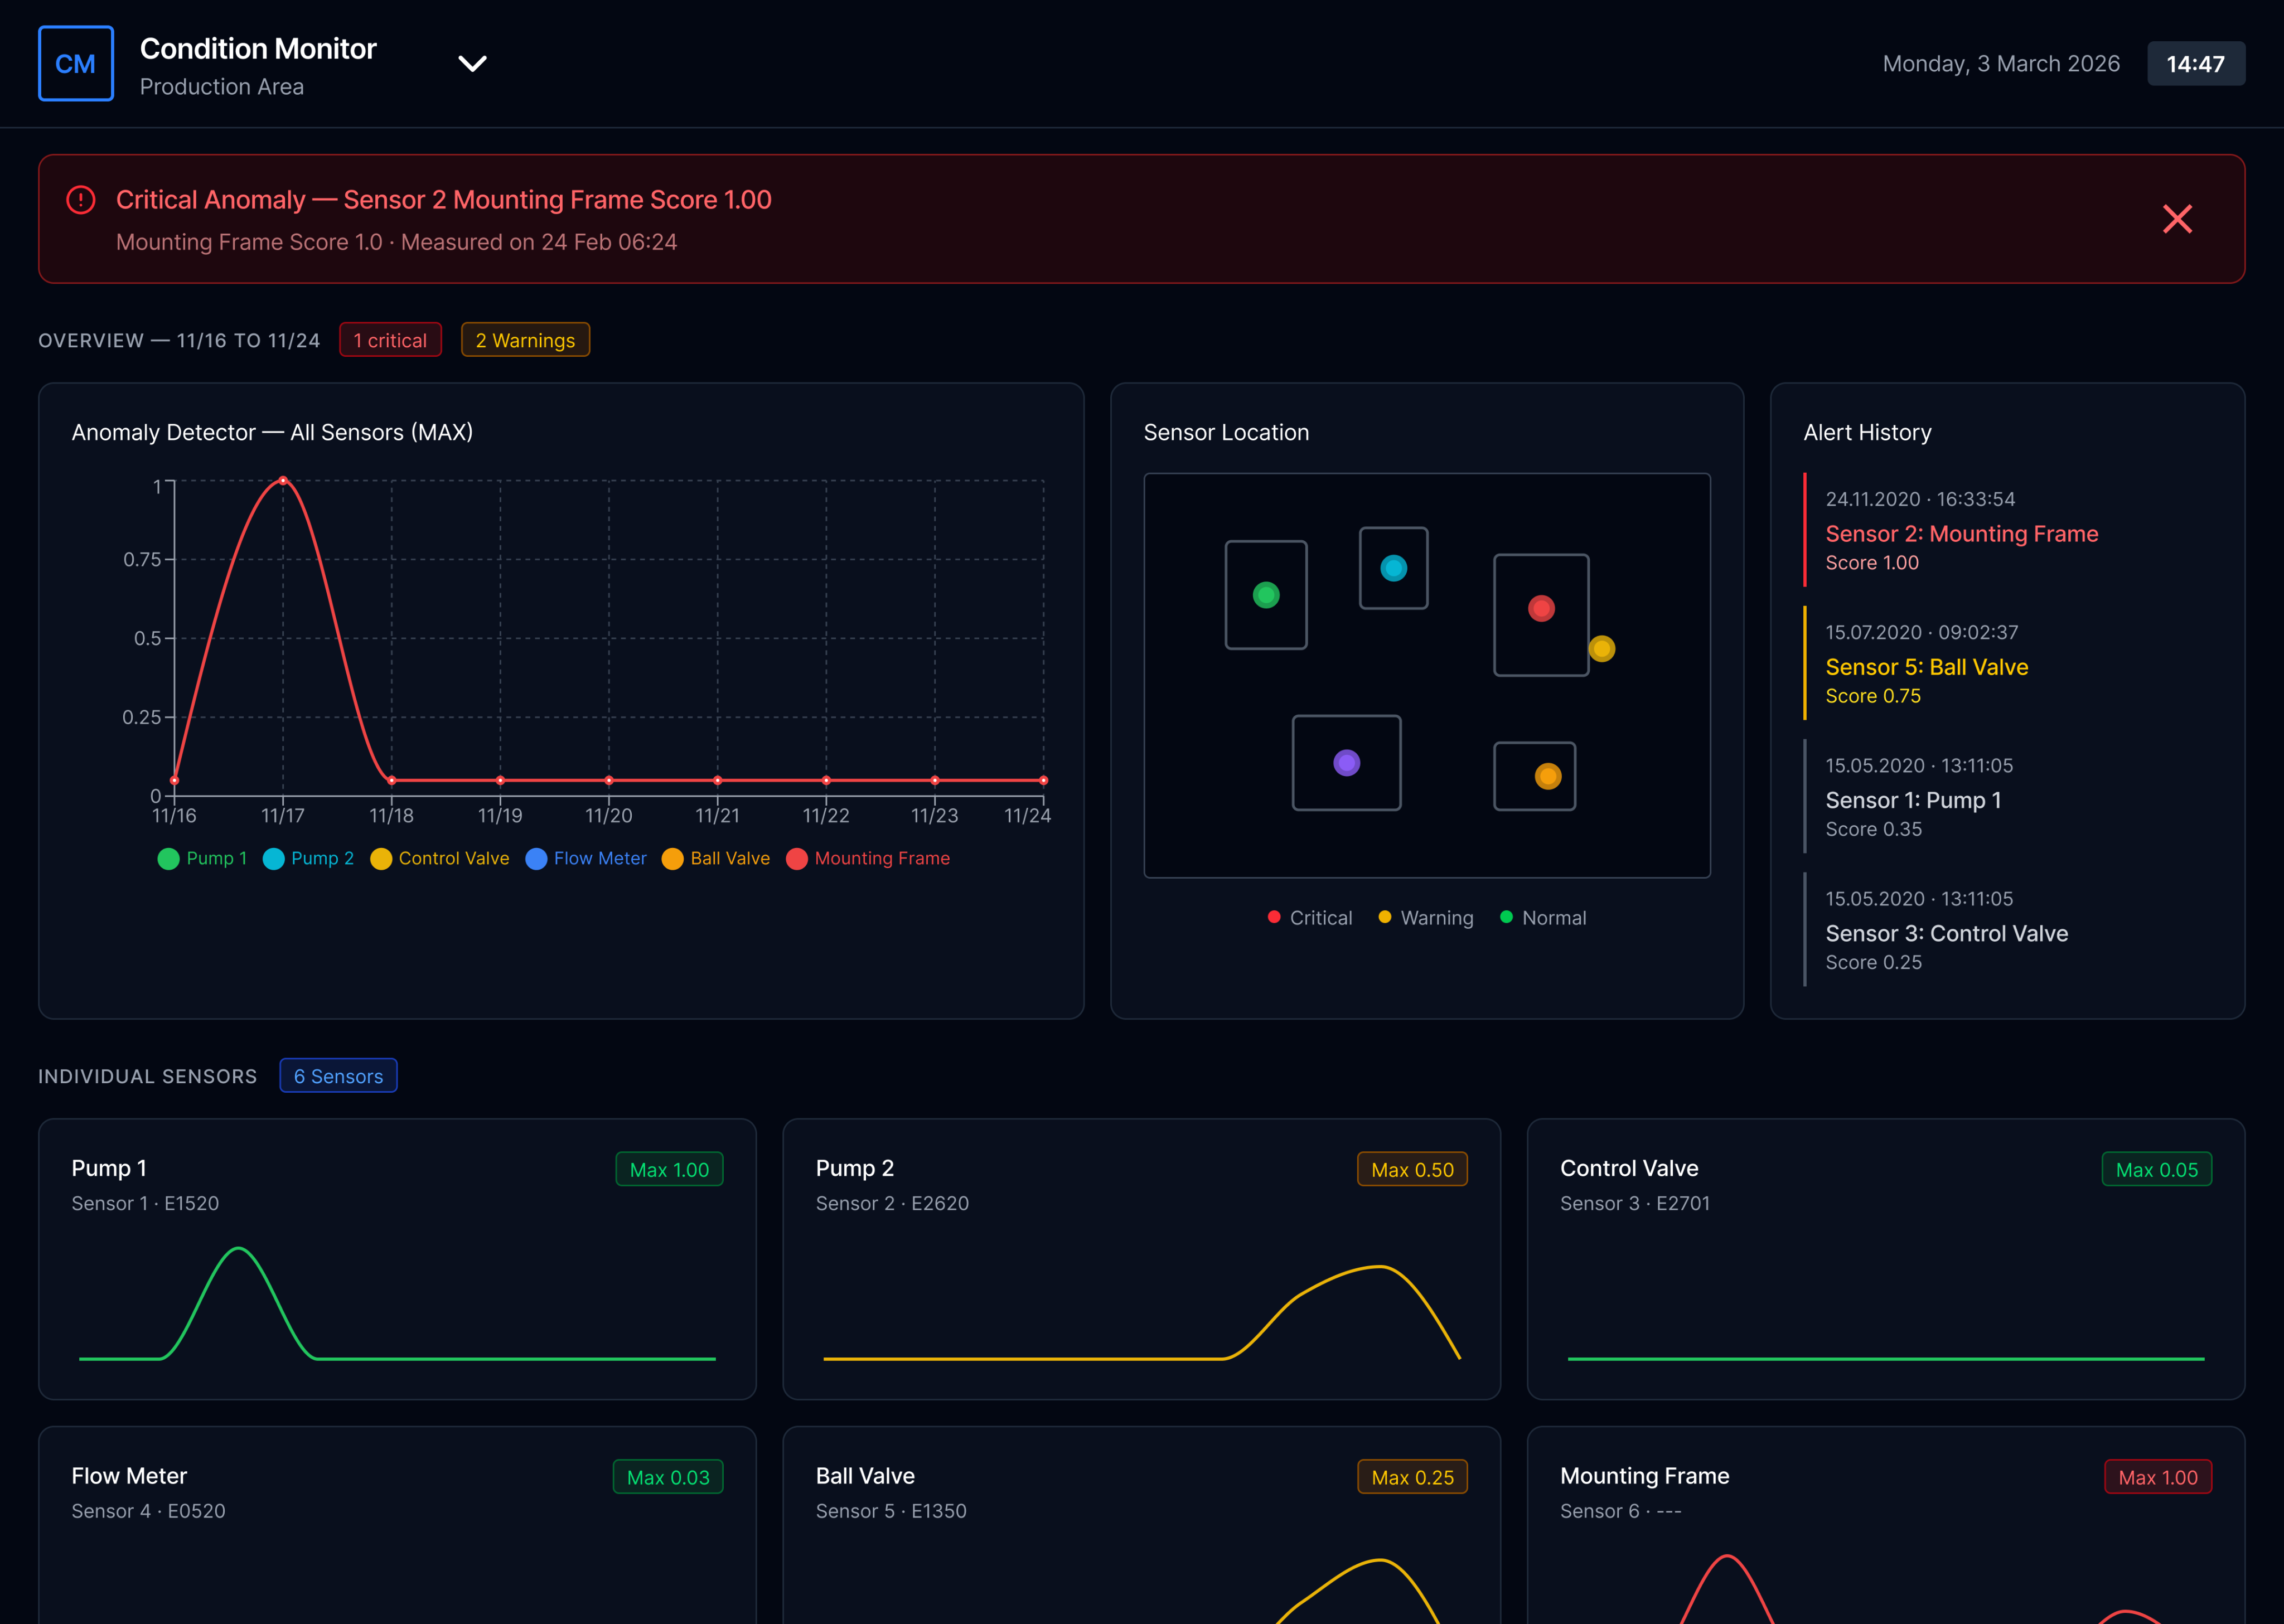
Condition Monitor
Anomaly detection across sensors: location mapping, alert history, individual sensor trends
Anomaly Detection
Each was built for a different client with a different set of assets and operational context. The underlying information architecture, alert logic, and data hierarchy were rebuilt from scratch each time — these are examples of a consistent approach, not a single shared system.
Pre-sales UX: a different kind of brief, a different kind of process
Most UX work begins with an existing product and a user base you can study. This started differently every time. A potential client would express interest, the commercial team would brief me, and from that point I had to get from a vague use case to a deployed, client-trained dashboard — without a formal research phase, always within a commercial timeline.
Commercial
Brief & context
Discovery
Engineer-led
PM or marketing brief. Client use case described. Commercial context established.
Joint meeting, then separate session with process engineers — the real brief happens here.
Design & validate
Iterative loops
Delivery
Ship & onboard
First concept → developer feasibility → back to engineer → client walkthrough → iterate → repeat.
Developer handoff. Manual document, client onboarding session. Full arc owned by me.
The highlighted step — the process engineer session — was where the project actually started. These were the people who understood the client's machinery, sensors, and operational workflow at a level nobody else in the room had.
Marketing / PM
Commercial context. Client goals. What success looks like commercially.
Process Engineers ★
What assets exist, how they behave, and what the sensors can surface. The real constraints.
Developers
What's technically feasible. Implementation effort per design decision.
Client
Operational reality. The final word on whether the logic makes sense to people who run the assets.
I wasn't able to run formal user research on the people who would ultimately use these dashboards. What I could do was get as close as possible to their domain — and remain willing to scrap initial concepts when my mechanical understanding turned out to be wrong. Which it often was.
More information on screen does not mean more awareness
The core challenge was consistent across every dashboard: industrial processes generate enormous amounts of data, and clients initially want to see all of it. The first version of almost every dashboard was too dense. The design work was largely about helping clients understand that a screen which shows everything shows nothing clearly.
"The real question for every element was: does an operator need to see this continuously, or only when something deviates? That distinction between ambient monitoring and exception alerting shaped every layout decision."
Plant Monitoring Dashboard — real-time asset parameters with deviation alerts
More information on screen does not mean more awareness
The Plant Intelligence dashboard started as a straightforward monitoring brief: track batch production in real time. Current order, progress, materials, timing. Show the operator what's happening.
The insight that changed the scope
Working through the process with engineers and operators, a pattern kept emerging that nobody had explicitly mentioned in the brief. A machine might need cleaning before a new batch could run. An ingredient might not be ready. There was no system-level mechanism to prevent a production order from being started in conditions where it would fail or cause contamination.
I proposed adding it. If the conditions for starting an order weren't met, the system should reflect that state clearly halt the automatic process, surface the specific blocker, and hold the batch in queue rather than allowing an operator to force-start something that wasn't ready.
Original brief
- Show current batch status and progress.
- Display materials and timing.
- Queue next order information.
What was added
- Machine readiness state — cleaning required before start.
- "Unable to Start" — blocks order if prerequisites unmet
- Automatic process halt — batch returns to queue safely
What This Project Taught Me
01
Domain knowledge is a design input, not background reading
The process engineers weren't stakeholders to manage — they were co-authors. Every time I tried to work from second-hand information, the concept was wrong. Every time I went back to the engineer directly, it improved. In complex technical domains, humility about your own understanding is a design skill.
02
Industrial clients don't trust what they can't explain to themselves
A dashboard that looks impressive but can't be interrogated will be abandoned. The design has to be logically legible — an operator should be able to explain to a colleague why the system is showing what it's showing. That's a higher bar than consumer UX, and it changes what "simple" means.
03
The brief is always incomplete — your job is to find what's missing
The "Unable to Start" state wasn't in the original scope. It existed in the client's operational reality but hadn't been translated into a product requirement. Finding those gaps — and proposing solutions to problems the client hadn't formally articulated — is what moves the work from executing a brief to genuinely improving how operators manage their assets.
Role
UX Designer
Type of User
Process Engineers, Operators & Managers
Arc
Brief → discovery → design → client → handoff → onboarding


Dashboards for People Who Can't Afford to Misread a Machine
Ten+ industrial monitoring dashboards designed for real-time asset health visibility — where commercial teams initiated the projects, process engineers defined the real constraints, and the people ultimately using them were responsible for production that couldn't stop. Three are documented here.


Michael Gibran
Senior Product Designer
Berlin, Germany


© 2026 Michael Gibran