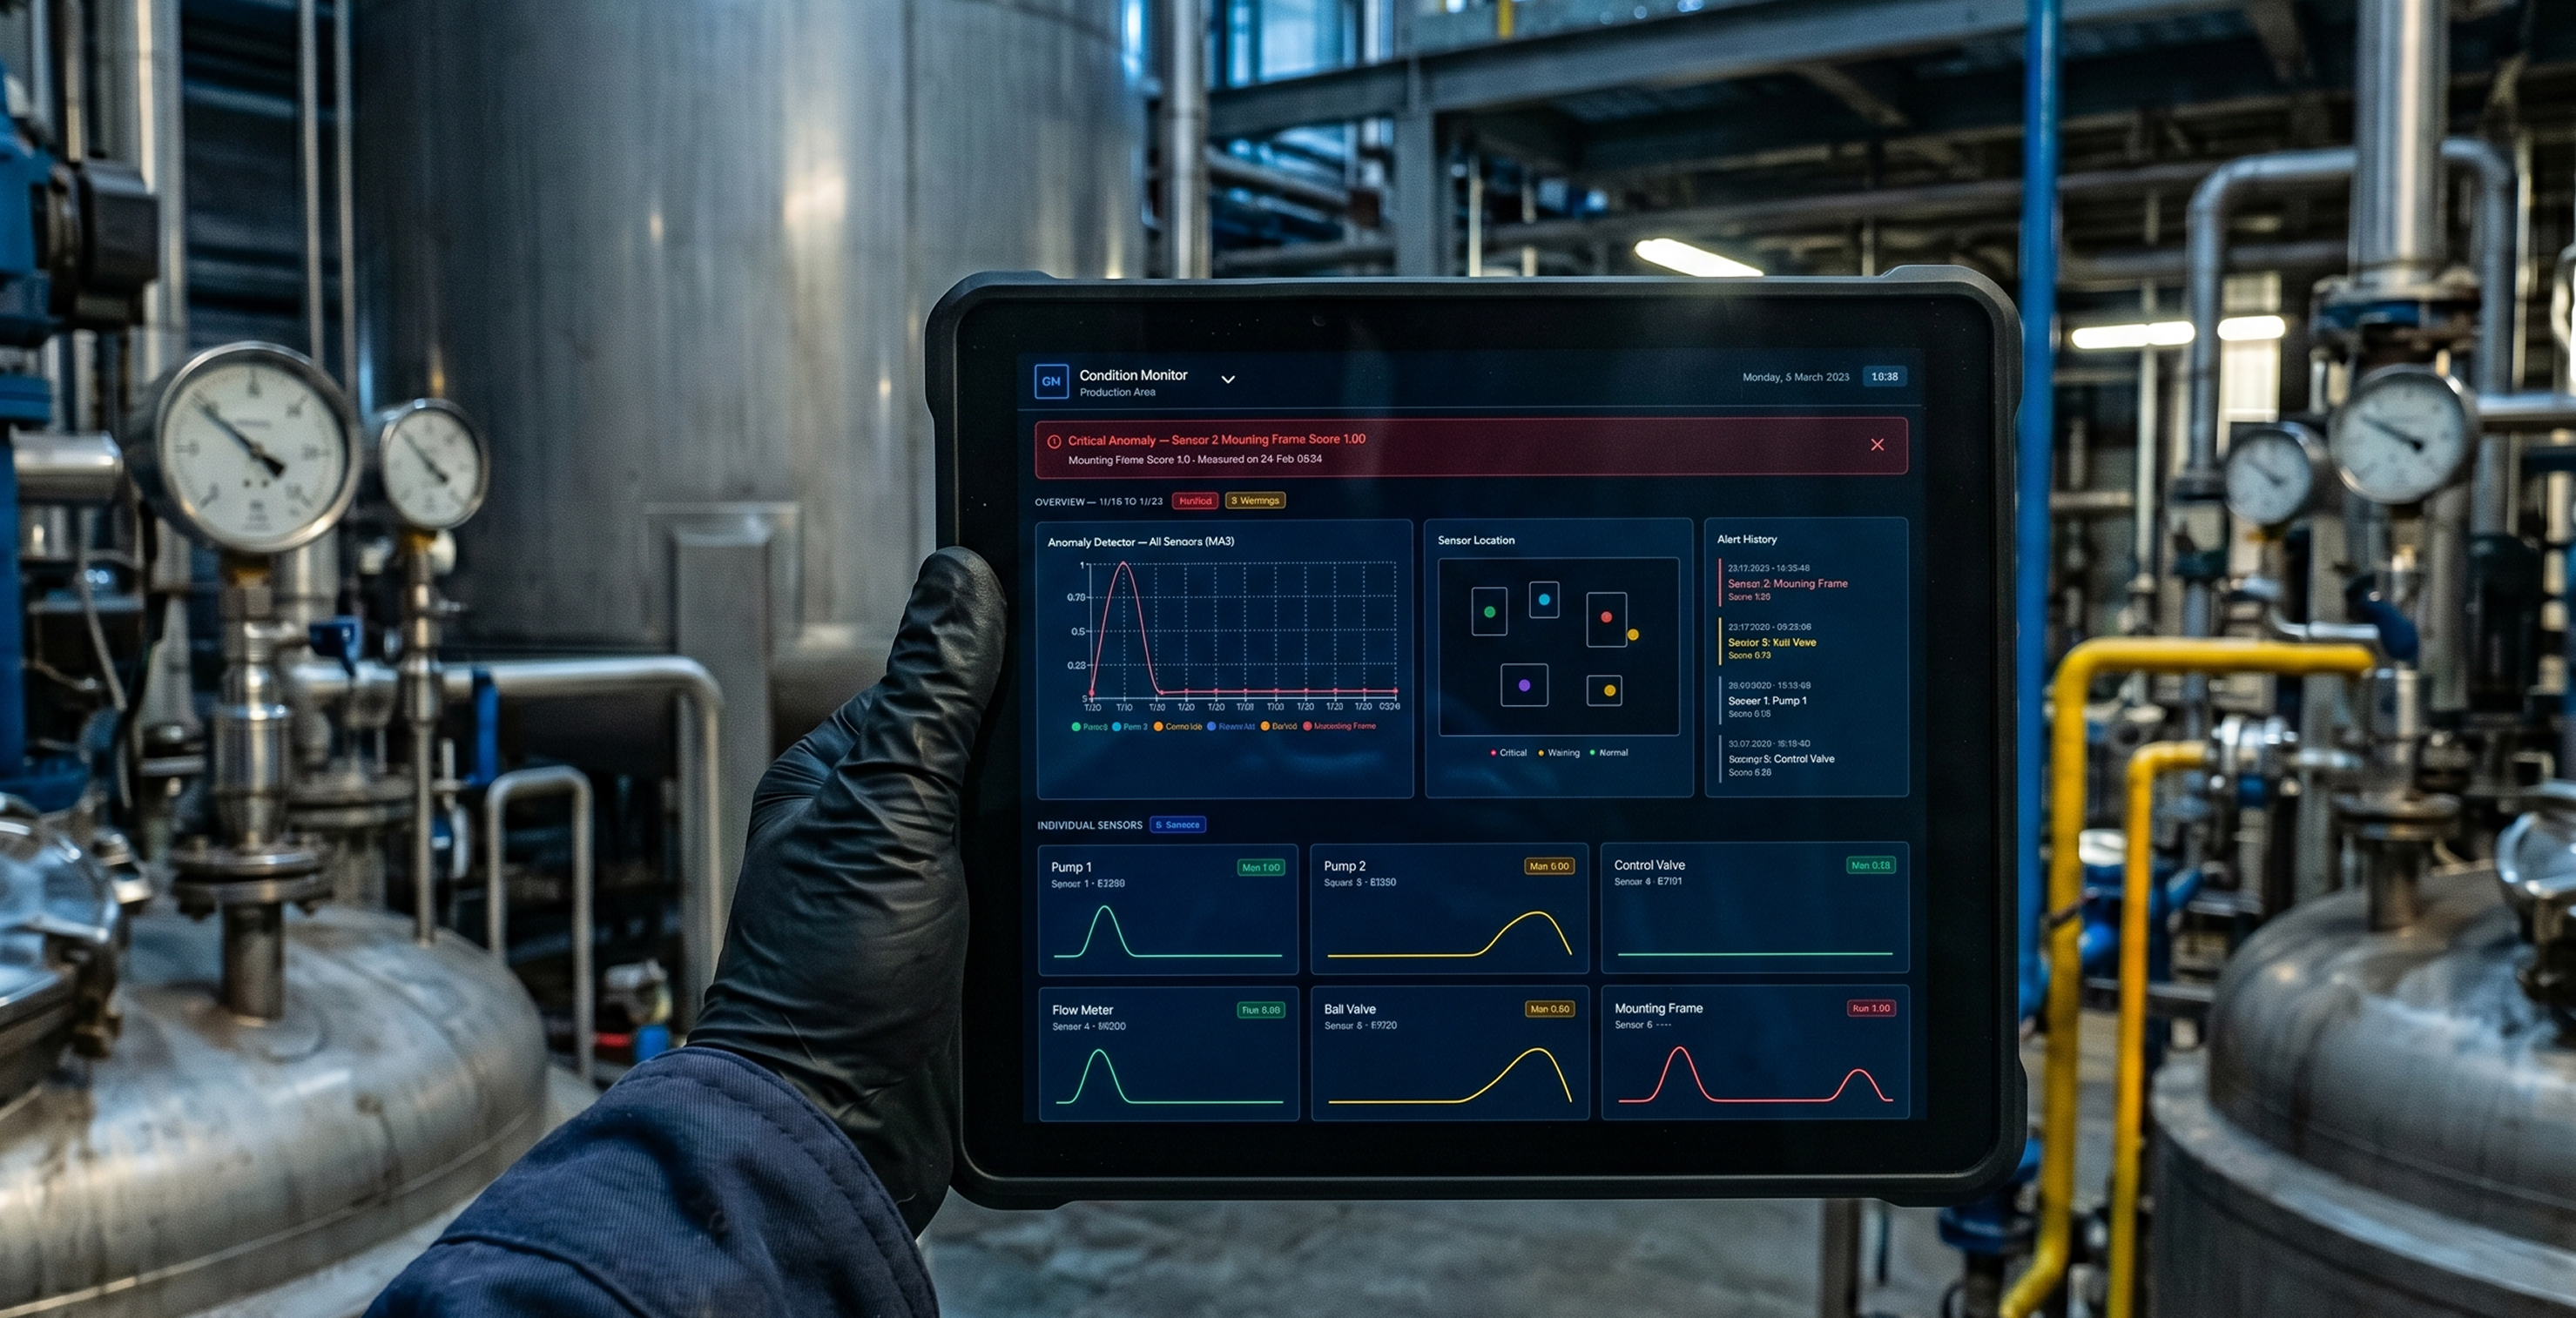
Ten+ industrial monitoring dashboards designed for real-time asset health visibility — where commercial teams initiated the projects, process engineers defined the real constraints, and the people ultimately using them were responsible for production that couldn't stop. Three are documented here.
Process engineers and plant operators don't sit in front of dashboards studying them. They glance — and in that glance, they need to know whether the assets they're responsible for are running within normal parameters or whether something requires immediate attention.
Each was built for a different client with a different set of assets and operational context. The underlying information architecture, alert logic, and data hierarchy were rebuilt from scratch each time — these are examples of a consistent approach, not a single shared system.
Most UX work begins with an existing product and a user base you can study. This started differently every time. A potential client would express interest, the commercial team would brief me, and from that point I had to get from a vague use case to a deployed, client-trained dashboard — without a formal research phase, always within a commercial timeline.
The highlighted step — the process engineer session — was where the project actually started. These were the people who understood the client's machinery, sensors, and operational workflow at a level nobody else in the room had.
I wasn't able to run formal user research on the people who would ultimately use these dashboards. What I could do was get as close as possible to their domain — and remain willing to scrap initial concepts when my mechanical understanding turned out to be wrong. Which it often was.
The core challenge was consistent across every dashboard: industrial processes generate enormous amounts of data, and clients initially want to see all of it. The first version of almost every dashboard was too dense. The design work was largely about helping clients understand that a screen which shows everything shows nothing clearly.
The Plant Intelligence dashboard started as a straightforward monitoring brief: track batch production in real time. Current order, progress, materials, timing. Show the operator what's happening.
I proposed adding it. If the conditions for starting an order weren't met, the system should reflect that state clearly — halt the automatic process, surface the specific blocker, and hold the batch in queue rather than allowing an operator to force-start something that wasn't ready.